10 Best Green Machine Optical Sorters for Global Buyers?
The global recycling industry is under pressure to recover more material from faster-moving waste streams. The World Bank’s What a Waste 2.0 report estimated 2.01 billion tonnes of municipal solid waste in 2016, with annual volumes potentially reaching 3.40 billion tonnes by 2050. The OECD’s Global Plastics Outlook also reported 353 million tonnes of plastic waste in 2019, while only 9% was recycled. These figures explain why the Green Machine Optical Sorter attracts attention from international buyers.
Optical sorting can identify color, polymer type, shape, or material density within milliseconds. However, performance depends on feed preparation, belt speed, moisture, lighting, and contamination. It is not a magic box. That assumption needs challenging. Volker Rehrmann, a recognized recycling-technology executive at TOMRA, has repeatedly promoted the principle of “making waste a resource.” The idea sounds simple. The engineering is not.
This guide compares ten leading Green Machine Optical Sorter options for global buyers. It considers detection accuracy, usable throughput, reject quality, energy demand, software controls, maintenance access, and local technical support. The European Environment Agency and the U.S. Environmental Protection Agency both emphasize better separation as a practical route toward higher recycling quality. Still, published figures rarely match every facility. A sorter tested on clean, dry packaging may struggle with wet mixed waste. Buyers should request plant trials, audited recovery data, spare-parts commitments, and references from similar operations. The strongest purchase decision may not involve the fastest machine. It may involve the most honest performance baseline.
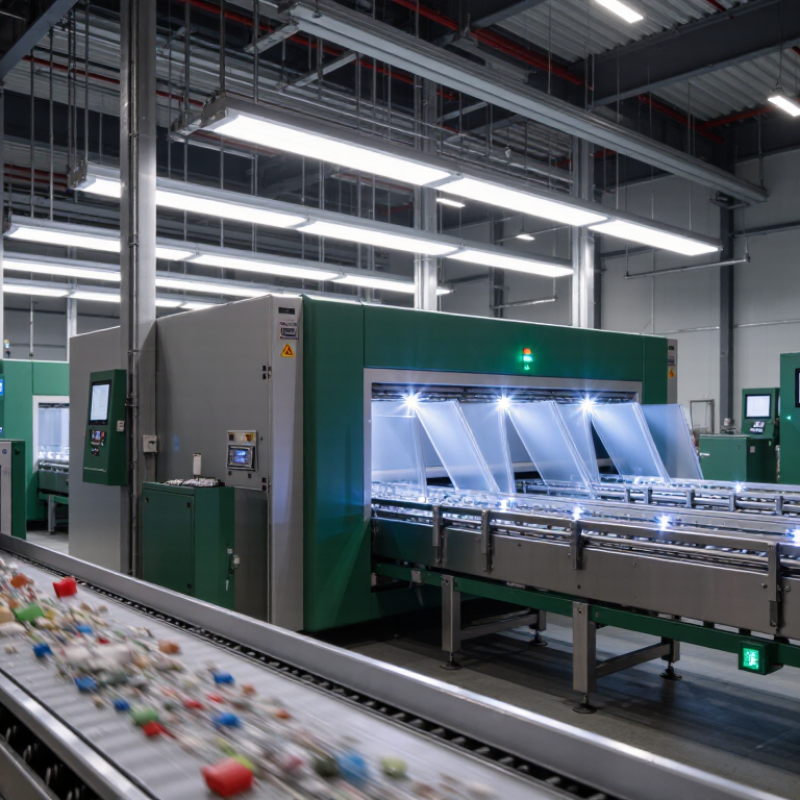
Optical Sorting Basics: NIR Detection from 900–1700 nm for Material ID
10 Best Green Machine Optical Sorters for Global Buyers?
Optical sorting identifies materials by measuring how they reflect light. NIR detection usually covers 900–1700 nm, where many materials show distinct spectral patterns. A near-infrared sensor scans items as they move across a conveyor. Software compares each signal with a validated material library. Air jets then separate selected pieces at precise points.
This process can distinguish common polymers, paper fibers, organic residues, and several mineral categories. Surface condition matters. Dust, moisture, labels, and dark colors may weaken the reflected signal. Stable conveyor speed also improves timing accuracy. In practical testing, operators should inspect calibration results under real lighting and loading conditions. Laboratory samples can look cleaner than daily production streams.
The best green machine optical sorter is not always the one with the highest scan rate. Detection range, sensor resolution, ejection response, and maintenance access deserve equal attention. A clear reject log helps technicians identify drift or misclassification. Small errors accumulate quickly. One honest limitation remains: NIR cannot reliably identify every material from surface data alone. Layered products, heavy contamination, and similar chemical signatures may require additional sensors or manual review. Regular verification keeps performance credible, though verification routines themselves can be inconsistent without disciplined records.
NIR Detection Reference: Material Identification from 900–1700 nm
Near-infrared optical sorters identify materials by detecting characteristic absorption features. Water and hydroxyl compounds commonly show bands near 970 nm and 1450 nm, while C–H and organic-bond responses are commonly observed around 1200–1250 nm. These reference bands help distinguish moisture, paper, plant fibers, food residues, and polymer-rich materials during high-speed sorting.
Core Specifications: 0.5–2 mm Resolution and 98–99.9% Sorting Purity
10 Best Green Machine Optical Sorters for Global Buyers?
For global buyers, resolution and sorting purity deserve more attention than polished machine photos. A 0.5–2 mm resolution range can identify small color, shape, and surface differences in processed materials. The practical result depends on conveyor stability, camera quality, and controlled lighting. Tiny particles need sharper imaging and cleaner air flow.
A sorting purity of 98–99.9% sounds impressive, but testing conditions matter. Experienced suppliers should provide sample reports, reject rates, capacity figures, and test procedures. Ask whether purity was measured on clean feedstock or mixed production waste. That difference can change purchasing decisions quickly. Real samples matter most.
Calibration is not a one-time task. Dust, moisture, uneven feeding, and material overlap can reduce accuracy during daily operation. Operators should inspect lenses, air nozzles, and ejector timing regularly. Keep records. A 99.9% claim may not fit every material or production line. That is where buyers need careful judgment, not optimistic assumptions. A short factory trial can reveal false confidence, unstable throughput, or excessive product loss before installation.
10 Best Green Machine Optical Sorters for Global Buyers? - Core Specifications: 0.5–2 mm Resolution and 98–99.9% Sorting Purity
| Ranking | Anonymous Unit | Recommended Material | Optical Resolution | Rated Throughput | Sorting Purity | Detection Method | Camera Channels | Air Pressure | Installed Power | Feed Width | Best-Fit Application |
| 01 | Unit A-120 | Green coffee and small seeds | 0.5 mm | 1.5–2.5 t/h | 99.8% | RGB + NIR | 4 | 0.60–0.80 MPa | 4.5 kW | 600 mm | High-precision defect removal |
| 02 | Unit B-180 | Green beans and pulses | 0.6 mm | 2.0–3.5 t/h | 99.5% | Full-color CCD | 6 | 0.60–0.80 MPa | 5.5 kW | 720 mm | Medium-volume food processing |
| 03 | Unit C-240 | Leafy vegetables and herbs | 0.8 mm | 3.0–5.0 t/h | 99.2% | RGB + shape analysis | 8 | 0.60–0.80 MPa | 7.0 kW | 960 mm | High-throughput green produce lines |
| 04 | Unit D-300 | Peas, lentils, and legumes | 1.0 mm | 4.0–6.0 t/h | 99.0% | RGB + infrared | 10 | 0.60–0.80 MPa | 8.5 kW | 1,200 mm | Large agricultural processing plants |
| 05 | Unit E-360 | Rice, grains, and green kernels | 1.2 mm | 5.0–8.0 t/h | 98.8% | CCD color sorting | 12 | 0.60–0.80 MPa | 11.0 kW | 1,440 mm | Maximum line capacity |
| 06 | Unit F-150 | Small seeds and botanical products | 0.5 mm | 1.0–2.0 t/h | 99.6% | RGB + NIR | 4 | 0.55–0.75 MPa | 4.0 kW | 500 mm | Compact installations and specialty crops |
| 07 | Unit G-210 | Coffee beans and dried produce | 0.7 mm | 2.5–4.0 t/h | 99.3% | RGB + shape analysis | 6 | 0.60–0.80 MPa | 6.0 kW | 840 mm | Flexible export-processing operations |
| 08 | Unit H-260 | Green nuts and irregular produce | 1.0 mm | 3.5–5.5 t/h | 98.7% | RGB + size analysis | 8 | 0.60–0.80 MPa | 7.5 kW | 1,000 mm | Mixed-size agricultural products |
| 09 | Unit I-320 | Legumes, grains, and seeds | 1.5 mm | 5.0–7.0 t/h | 98.5% | Color + defect recognition | 10 | 0.60–0.80 MPa | 9.5 kW | 1,280 mm | Cost-conscious bulk processing |
| 10 | Unit J-400 | High-volume green agricultural materials | 2.0 mm | 6.0–10.0 t/h | 98.0% | RGB color sorting | 12 | 0.60–0.80 MPa | 13.0 kW | 1,600 mm | Large-scale primary sorting |
Technical note: Throughput and purity depend on material variety, moisture, feed uniformity, contamination level, calibration, and operating speed. The listed values are practical comparison ranges for equipment configured for green agricultural materials; final specifications should be verified through a material test and supplier datasheet.
Throughput Comparison: Evaluate Systems Rated at 2–10 Tons per Hour
For global buyers comparing the 10 best green machine optical sorters, throughput is more than a catalog number. It shows how much material a system can process hourly. Real tests matter. A sorter rated at 2 tons per hour may suit a small recovery line with steady, clean feed. A 10-ton system needs wider conveyors, stronger air systems, and reliable material dosing. Otherwise, speed can reduce sorting accuracy.
At 2–4 tons per hour, operators often gain better control over mixed plastics, colored flakes, or small packaging streams. These systems allow slower belt movement and clearer camera decisions. At 5–7 tons, capacity and precision become harder to balance.
Feed depth, moisture, dust, and overlapping items can affect results. A 10-ton sorter may perform well with uniform material, but irregular feed can create missed ejections and more manual checking. High throughput is not automatically high productivity.
Buyers should request test data using their own material, not only factory samples. Measure accepted product quality, reject purity, energy use, and stoppage frequency during a full shift. Ask how the machine performs after dust builds on lenses. That detail is often overlooked. In field evaluations, the rated capacity sometimes feels optimistic, especially when material is wet or uneven. A practical target may be 70–85% of the advertised rate. Check service response, spare parts access, and operator training before selecting a sorter for continuous operation.
Energy and Sustainability: Compare Air-Ejector Power per Processed Ton
When comparing green machine optical sorters, measure air-ejector energy at the compressor input, not only at the sorter cabinet. The U.S. Department of Energy reports that compressed air can consume about 10% of industrial electricity, while leaks may waste 20–30% of compressor output. This makes air consumption a serious sustainability metric. A useful benchmark is compressor electricity per processed ton, expressed as kWh/t. For example, a 15 kW compressor serving a sorter processing 12 t/h uses approximately 1.25 kWh/t before leakage and dryer losses. Small figures become expensive at continuous throughput.
Test conditions matter greatly. Product moisture, belt loading, ejector timing, nozzle diameter, and reject rates can change the result. The European Commission’s Best Available Techniques reference documents also stress measuring utilities under real operating conditions, rather than trusting nominal equipment figures. Ask suppliers for logged air volume, pressure, compressor power, and tonnes processed during the same shift. Short tests can mislead. A clean spreadsheet can still lie.
In practical trials, compare three readings: sorter electrical demand, compressor input, and total kWh/t. Include idle periods and rejected material. The International Energy Agency repeatedly identifies efficiency measurement as a foundation for industrial emissions reduction, but measurement boundaries remain inconsistent across facilities. That weakness deserves attention. A sorter reporting 0.6 kWh/t may appear efficient, yet the figure means little if it excludes air dryers, standby time, or unstable feed conditions. Global buyers should request independent verification, preferably with calibrated power meters and several hours of representative production.
Global Buyer Checklist: Verify CE, ISO 9001, Warranty, and Local Service
Buying a green machine optical sorter requires more than comparing throughput and camera count. The compliance file matters. The ISO Survey 2022 recorded 1,265,216 ISO 9001 certificates worldwide, but certification alone does not prove sorter performance. Ask for the certificate number, issuing body, scope, and expiration date. Confirm that the factory’s scope covers design, assembly, testing, and after-sales support.
CE needs careful checking. The European Commission explains that CE marking is a manufacturer’s declaration of conformity, not a quality award. Request the EU Declaration of Conformity, risk assessment, electrical test records, and applicable standards. Inspect the machine label and technical file before shipment. A copied logo is not evidence. I have seen buyers focus on paperwork and overlook reject accuracy under dusty conditions. That mistake becomes expensive after installation.
Tips: Put warranty terms in the purchase contract. Define coverage for cameras, air valves, lighting, software, and labor. Set a response time for remote diagnosis and spare-parts delivery.
Ask for local technicians, training hours, and a commissioning checklist. Require a documented factory test using your actual material. A two-day demonstration may reveal less than a difficult seasonal batch. Also verify software updates and cybersecurity responsibilities. Local service can be vague, so request names, addresses, stock locations, and emergency contacts in writing.